

The reason for the stall in the rise of the gold price may be explained by the 2 figures above.
The first is a wave form that shows a growing US balance of trade deficit as a percentage of US GDP. It has rebounded a bit and is paused, but seems to be about to resume a strong downward thrust.
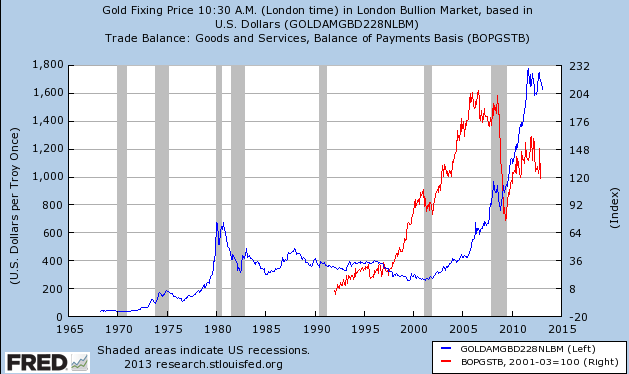
The second shows the strong correlation between the BoP deficit and price rises in gold. The level of BoP deficit doesn’t seem to be as important as the trend. The red line of the second figure is, to some scale, the inverse of the first figure.
In short, I think BoP has more to do with gold moves than QE.
